DigiScan360: End-to-End Data Analysis for Competitive Intelligence
An end-to-end data and semantic intelligence system for scalable competitive analysis across heterogeneous market data.
Team
Md Kamrul Islam, Hareem Raza, Muhammad Qasim Khan, and Narmina Mahmudova
Overview
DigiScan360 is an end-to-end intelligence system designed to address the challenges of competitive analysis in modern digital markets for headphone companies. Market-relevant information is inherently fragmented across e-commerce platforms, expert review websites, and social media, spanning structured records, semi-structured logs, and unstructured text. Traditional analytics pipelines largely centered on relational models—are insufficient to integrate these sources holistically or to capture complex relationships between products, brands, and consumer behavior.
This project unifies large-scale data ingestion, distributed processing, analytical modeling, and graph-based semantic representations within a single architecture. By combining data warehouse analytics with knowledge graph modeling and metadata-aware integration, DigiScan360 enables both quantitative analysis and relationship-driven reasoning over heterogeneous market data.
Design Objectives
- Integrate heterogeneous data — Structured and unstructured data from multiple external sources
- Preserve raw data fidelity — Enable scalable, distributed transformations while maintaining data integrity
- Enrich with semantic representations — Large-scale datasets augmented with graph-based and semantic models
- Support multi-mode analytics — Descriptive, predictive, and relational analytics
- Enable extensibility — Traceability and schema evolution through knowledge graph-based metadata
Key Contributions
- Designed an end-to-end, reproducible big data and semantic intelligence pipeline
- Integrated data warehouse analytics with knowledge graphs and metadata-aware modeling
- Formalized sentiment, weaknesses, and strengths analysis as feature engineering using LLMs
- Enabled multi-modal analytics and storytelling the outcomes using PowerBI dashboard
System Architecture
DigiScan360 follows a layered, end-to-end architecture that integrates heterogeneous data ingestion, scalable storage, distributed processing, semantic modeling, and analytical exploitation. Data flows through progressively refined stages from raw source data to curated analytical tables and semantic graphs while preserving lineage and traceability.
The architecture combines a data warehouse-based analytical backbone with graph-based semantic representations. Relational models support scalable quantitative analysis, while knowledge graphs capture higher-order relationships between products, brands, consumers, and content.
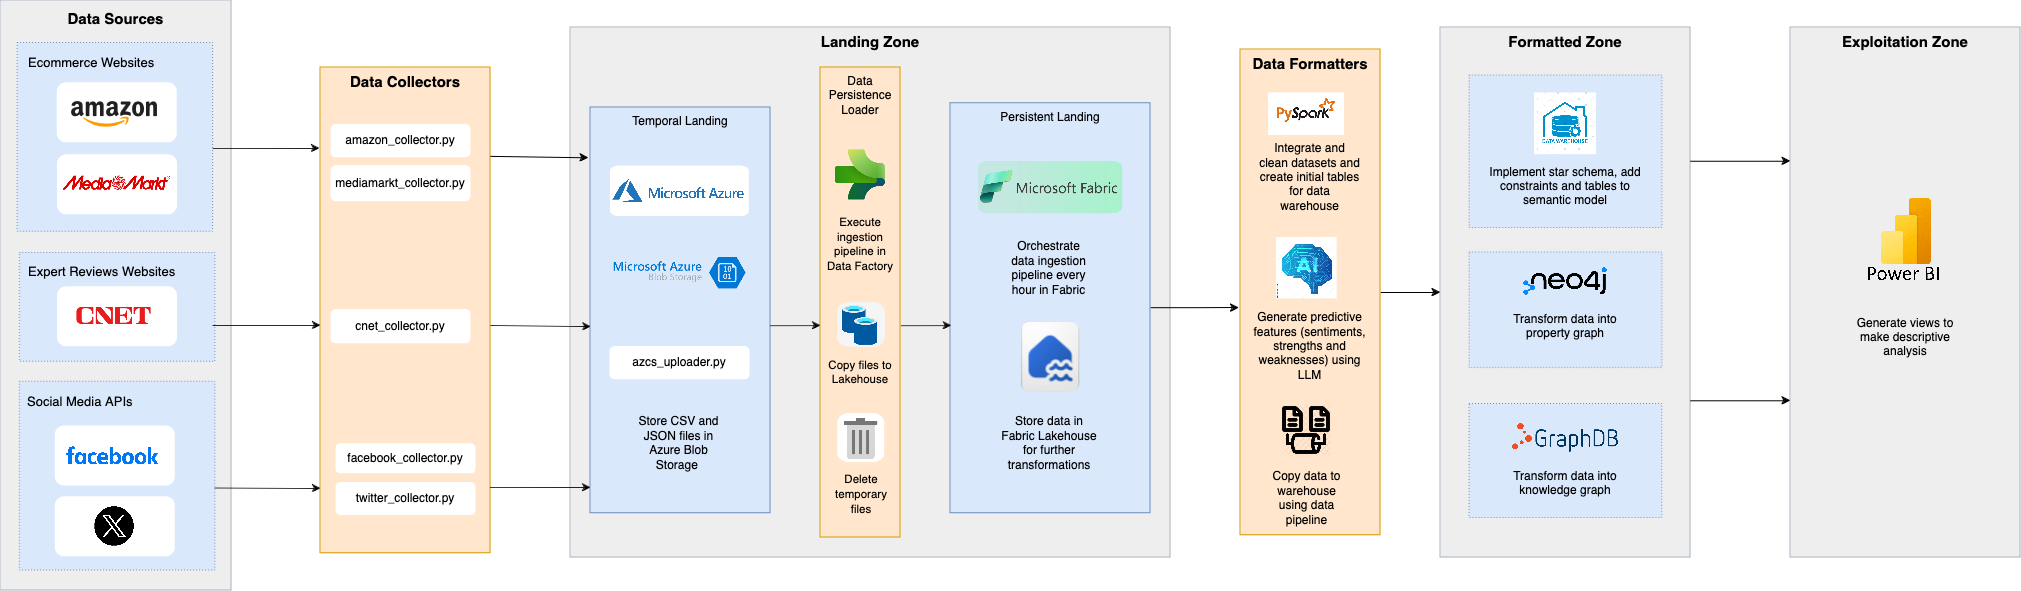
Figure 1 illustrates the complete DigiScan360 pipeline from data sources to analytical and semantic exploitation. The following sections describe each stage in detail.
Data Collection and Storage
Data collection
Data is collected from e-commerce platforms (Amazon, MediaMarkt), expert review websites (CNET), and social media platforms (Facebook, Twitter). Source-specific Python collectors encapsulate extraction logic while emitting standardized outputs, isolating downstream processing from source-specific changes and enabling extensibility.
For Facebook and Twitter with restricted or costly API access, synthetic datasets are generated based on official API specifications and augmented with noise and missing values to realistically simulate real-world conditions. All collection processes are logged and versioned to support reproducibility and auditing.
Storage and landing design
The architecture employs a two-stage landing strategy:
- Temporal Landing Zone: Raw CSV and JSON files are stored in Azure Blob Storage in their original form via automated upload scripts. This preserves data fidelity and supports schema-on-read processing, auditing, and reprocessing.
- Persistent Lakehouse: Azure Data Factory orchestrates ingestion pipelines that transfer validated data into a Microsoft Fabric lakehouse, where data is stored as versioned tables with transactional guarantees.
This separation decouples ingestion from downstream processing, enabling scalable transformations, fault isolation, and long-term maintainability.
Data Processing and Feature Engineering
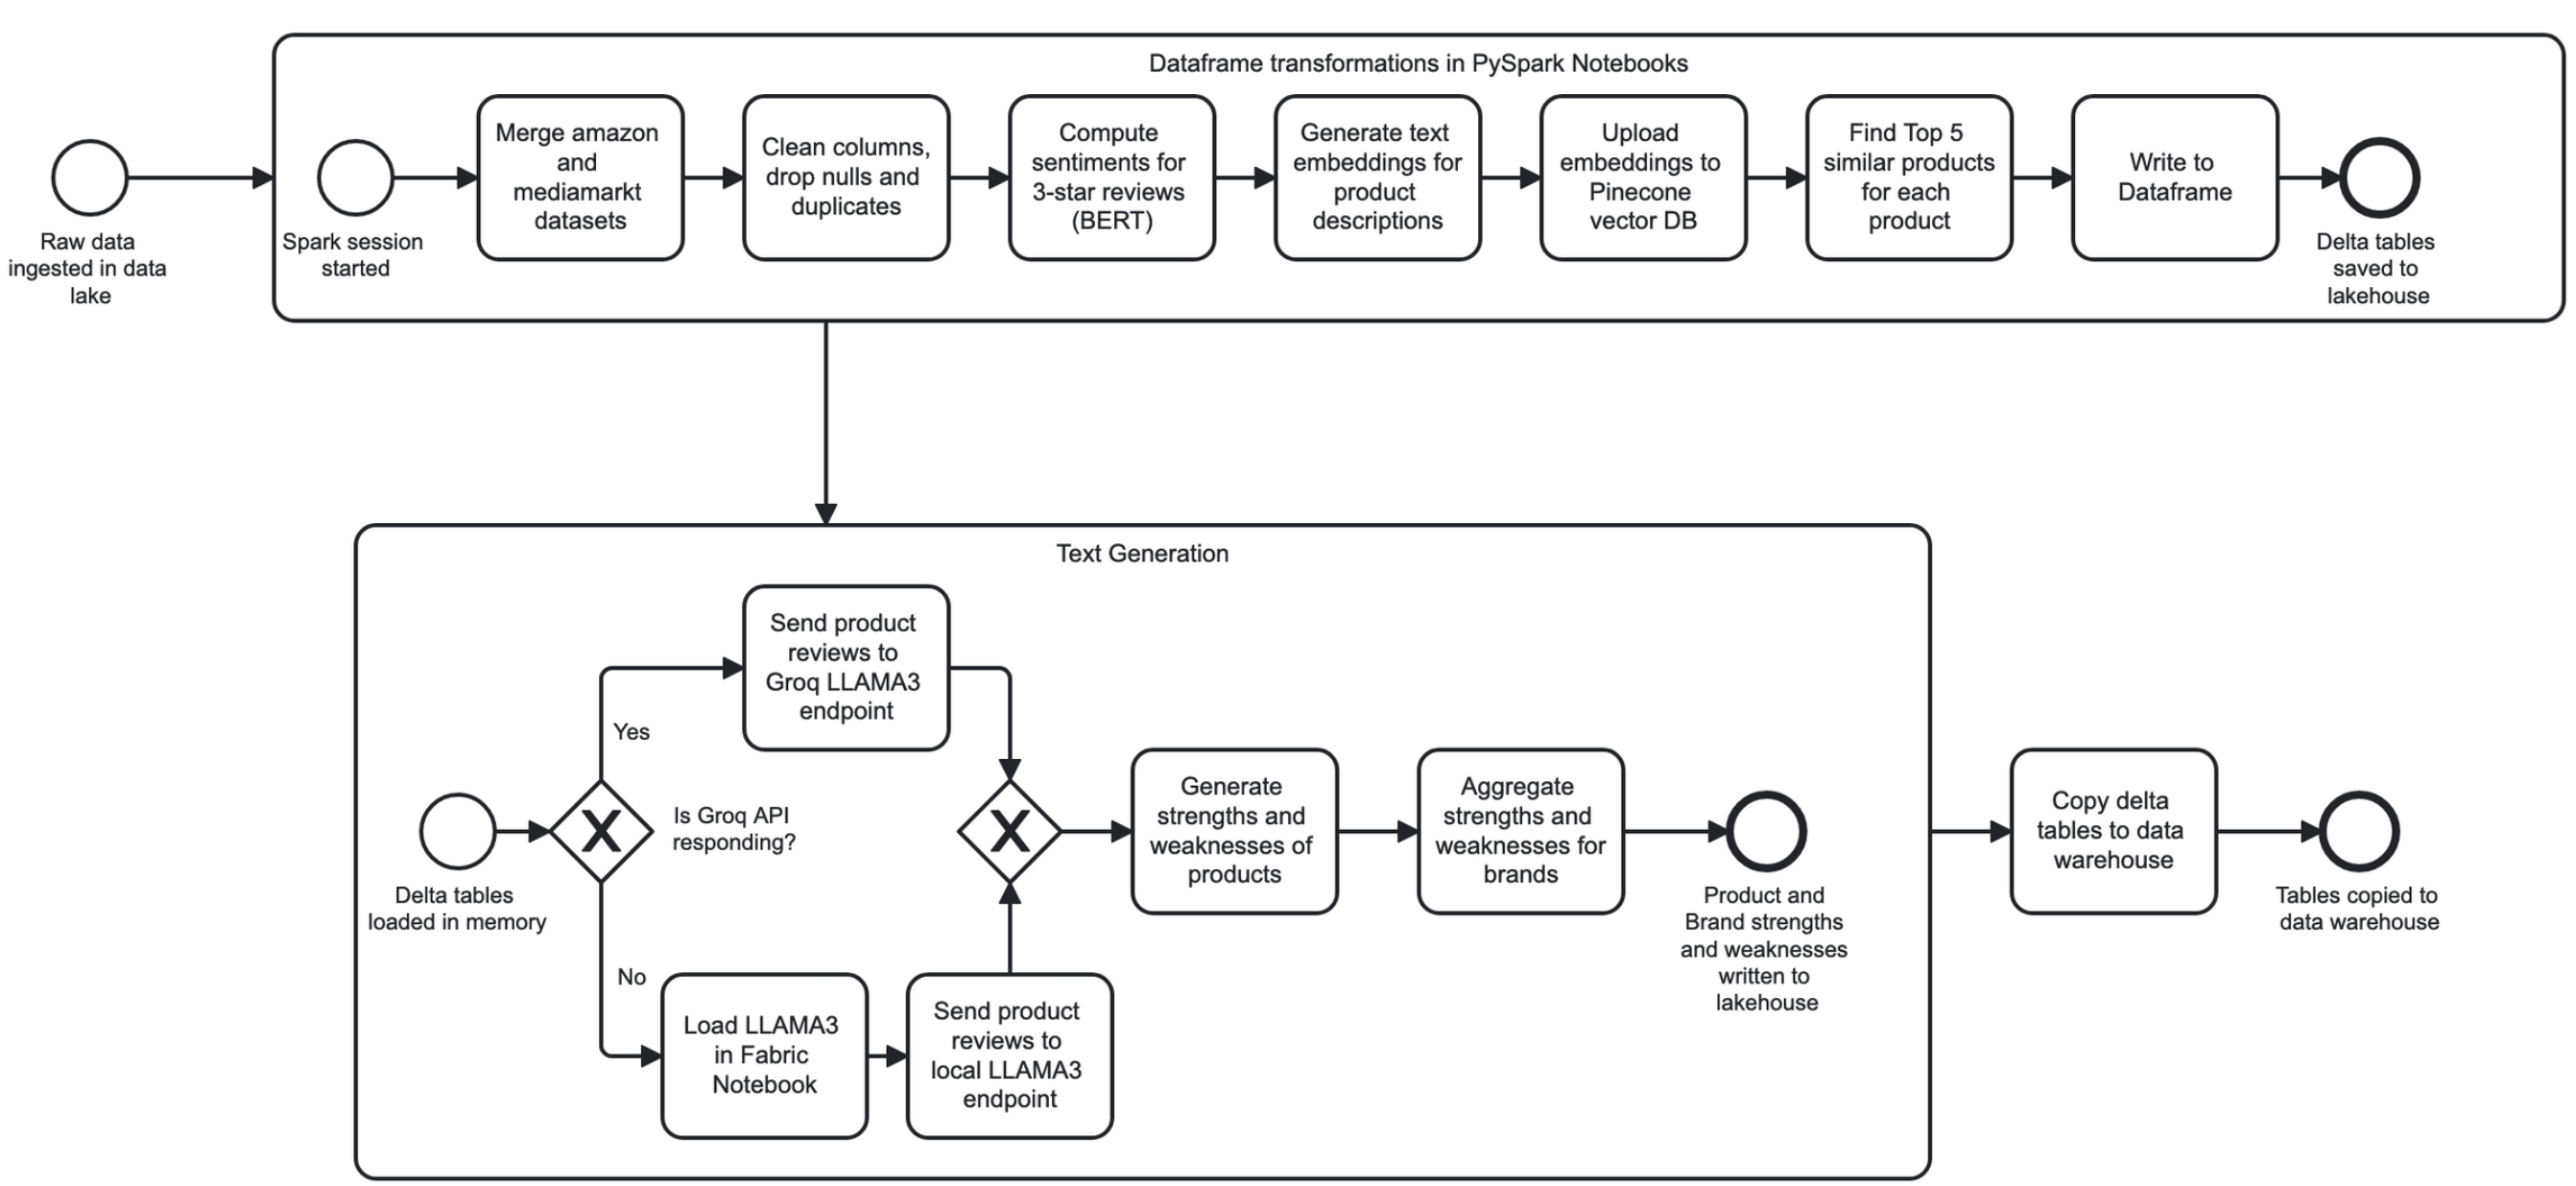
After ingestion into the persistent lakehouse, data is processed using distributed Spark-based workflows designed to clean, enrich, and align heterogeneous datasets for both analytical and semantic use.
Data cleaning and integration
Raw datasets undergo schema normalization, duplicate removal, missing-value handling, and noise reduction in textual fields. Multiple e-commerce sources are merged into unified product- and brand-level representations, enabling consistent downstream analysis across platforms.
Feature engineering and representation learning
To enrich analytical value beyond basic aggregates, the system derives higher-level features from unstructured text:
- Sentiment features extracted from reviews and social media content
- Text embeddings generated for product descriptions to support similarity analysis
- Product and brand similarity metrics computed using vector-based nearest-neighbor search
Engineered features are materialized as versioned tables in the lakehouse and selectively propagated to the data warehouse for analytical querying.
LLM-based semantic feature generation
In addition to statistical and embedding-based features, DigiScan360 integrates a controlled LLM-based enrichment workflow to extract qualitative semantic insights such as product and brand strengths and weaknesses. LLM outputs are treated as structured analytical features rather than free-form text.
Formatting and Exploitation
The formatting and exploitation layer bridges large-scale data processing with downstream analytical and semantic consumption. PySpark-based formatters standardize and enrich datasets before materializing them into structures optimized for analytics, graph modeling, and visualization.
Knowledge Graph and Property Graph Modeling
DigiScan360 employs complementary graph paradigms:
- A Knowledge Graph implemented in GraphDB using RDF and SPARQL to support semantic interoperability, metadata management, and ontology-driven reasoning
- A Property Graph implemented using Neo4j to enable efficient traversal-based analysis of product and brand relationships
Local schemas are mapped to global schemas using a Local-as-View (LAV) approach, enabling controlled integration and schema evolution.
Vector Search and LLM Integration
- Vector embeddings are indexed in Pinecone to support efficient similarity-based product comparison
- LLaMA-3, accessed via the Groq API, is used for sentiment analysis and semantic insight extraction
- A fault-tolerant execution strategy prioritizes external inference
Semantic and Graph-Based Modeling
To overcome the limitations of purely relational models in representing complex, evolving relationships, DigiScan360 incorporates a semantic and graph-based modeling layer. This layer provides a unified, machine-interpretable representation of domain entities and relationships, while explicitly modeling metadata such as provenance, schema mappings, and transformation logic. Treating metadata as a first-class graph entity enables traceability, controlled schema evolution, and reproducible integration.
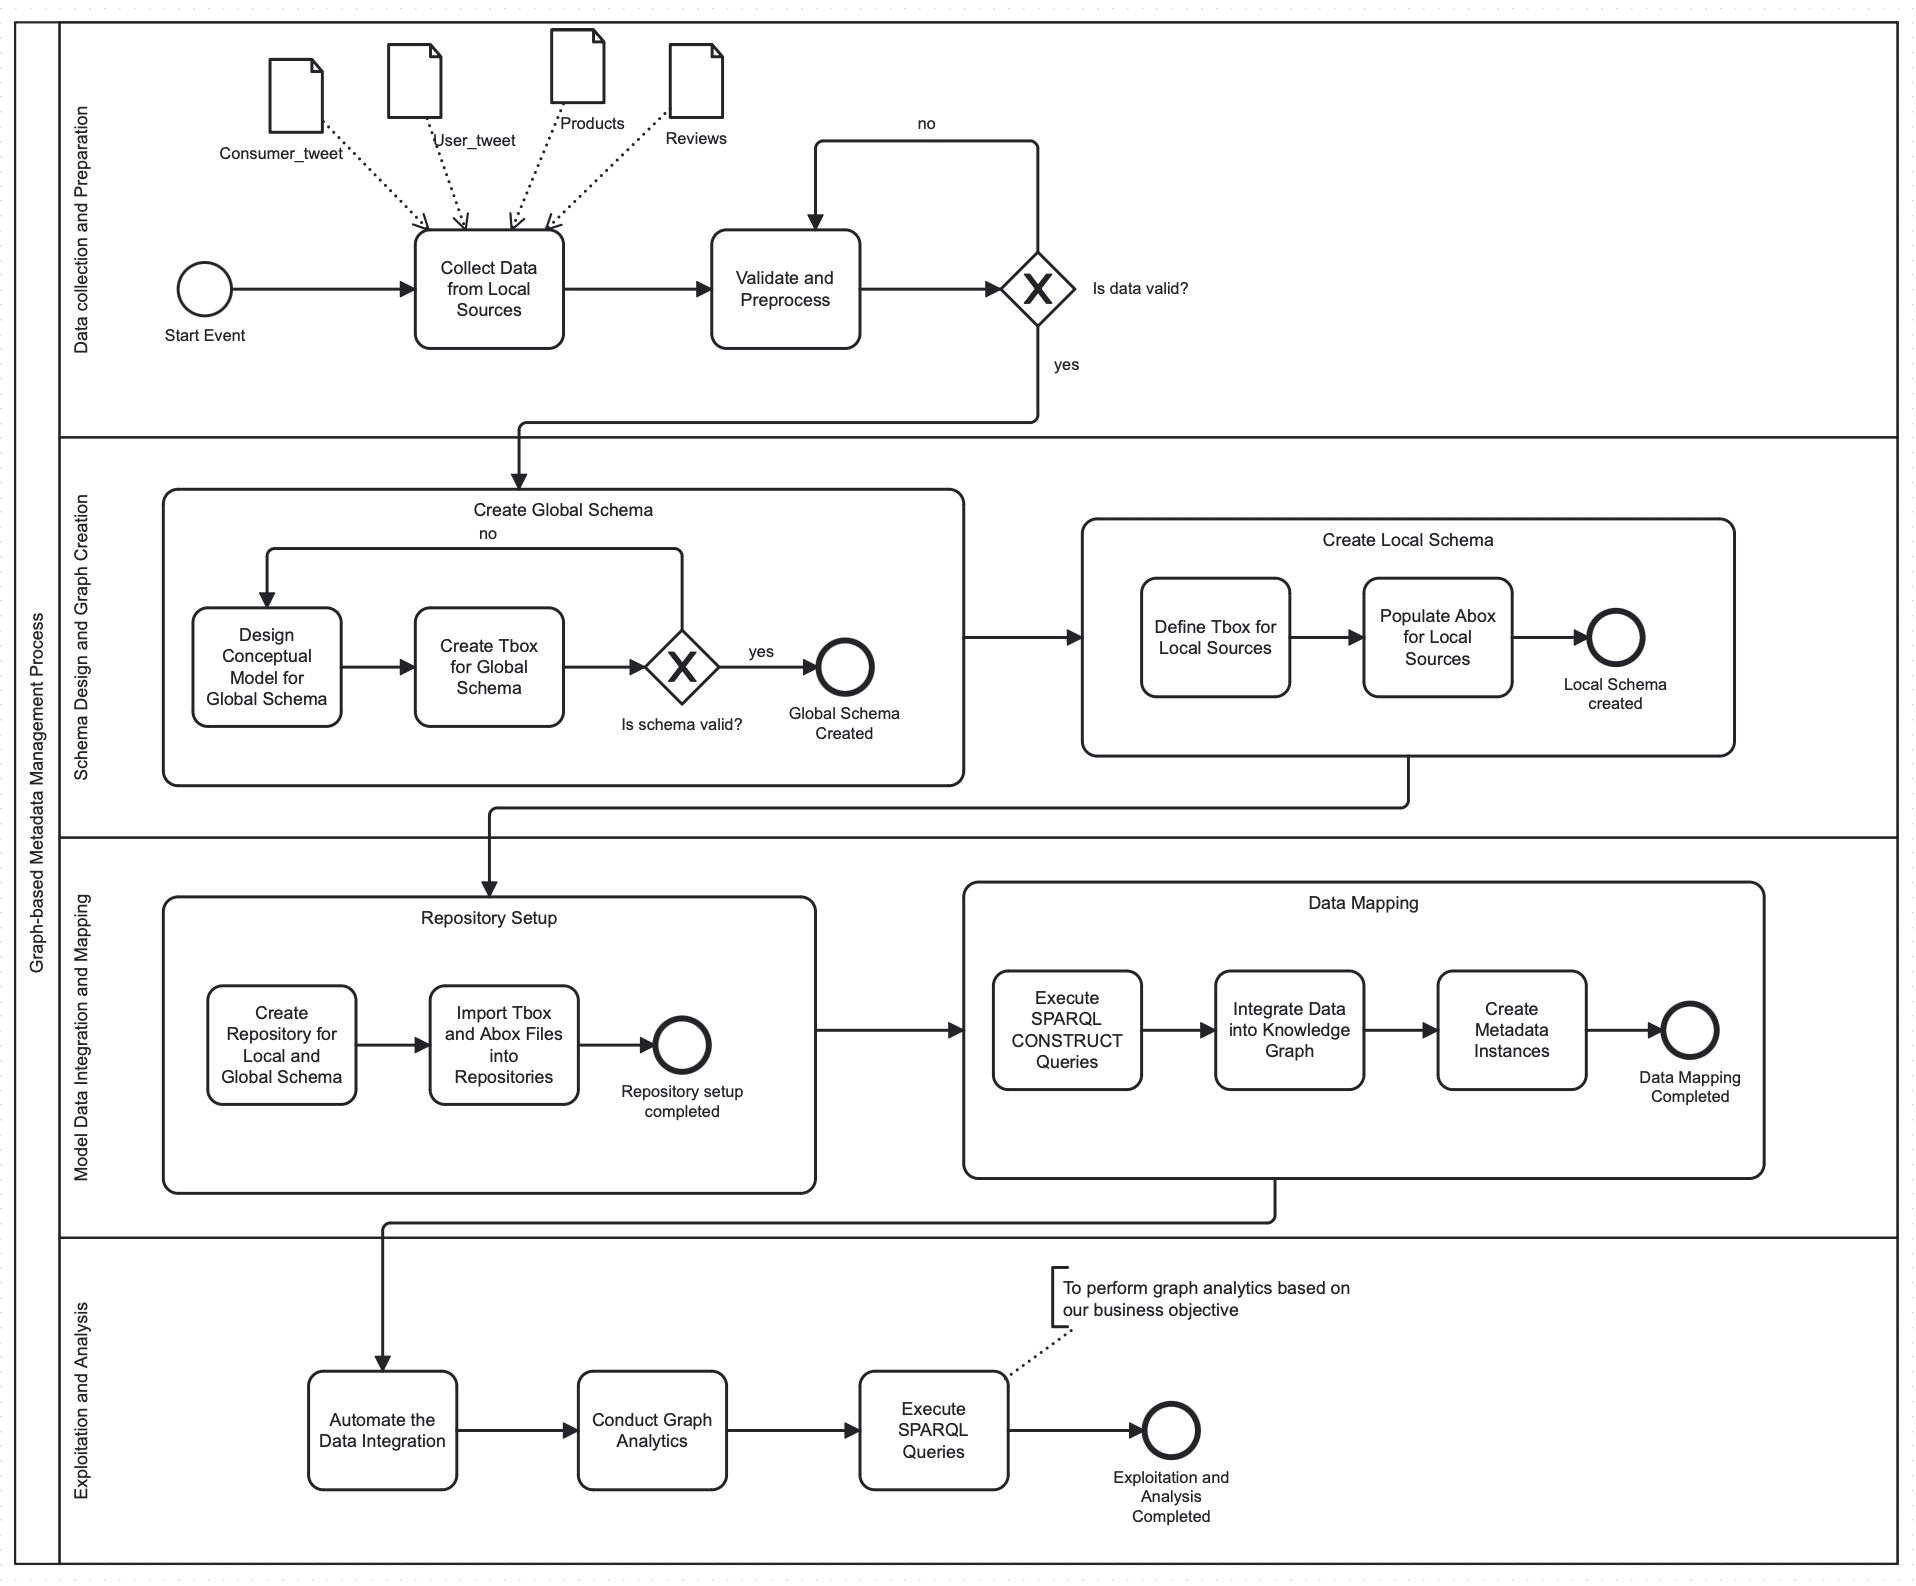
Key aspects include:
- Global semantic schema design
- Local-to-global schema mappings
- Graph-based metadata and provenance management
- BPMN-modeled semantic integration
- Relationship-centric analytical queries
Analytical Exploitation and Results
The analytical exploitation layer operationalizes the DigiScan360 pipeline by exposing curated analytical and semantic data through interactive views. Engineered features are materialized in a star-schema data warehouse and accessed through analytical queries optimized for descriptive and comparative analysis.
Business intelligence dashboards using PowerBI serve as both an exploitation and validation layer, enabling systematic exploration of market dynamics, brand performance, and consumer engagement, while validating upstream ingestion, processing, and modeling decisions.
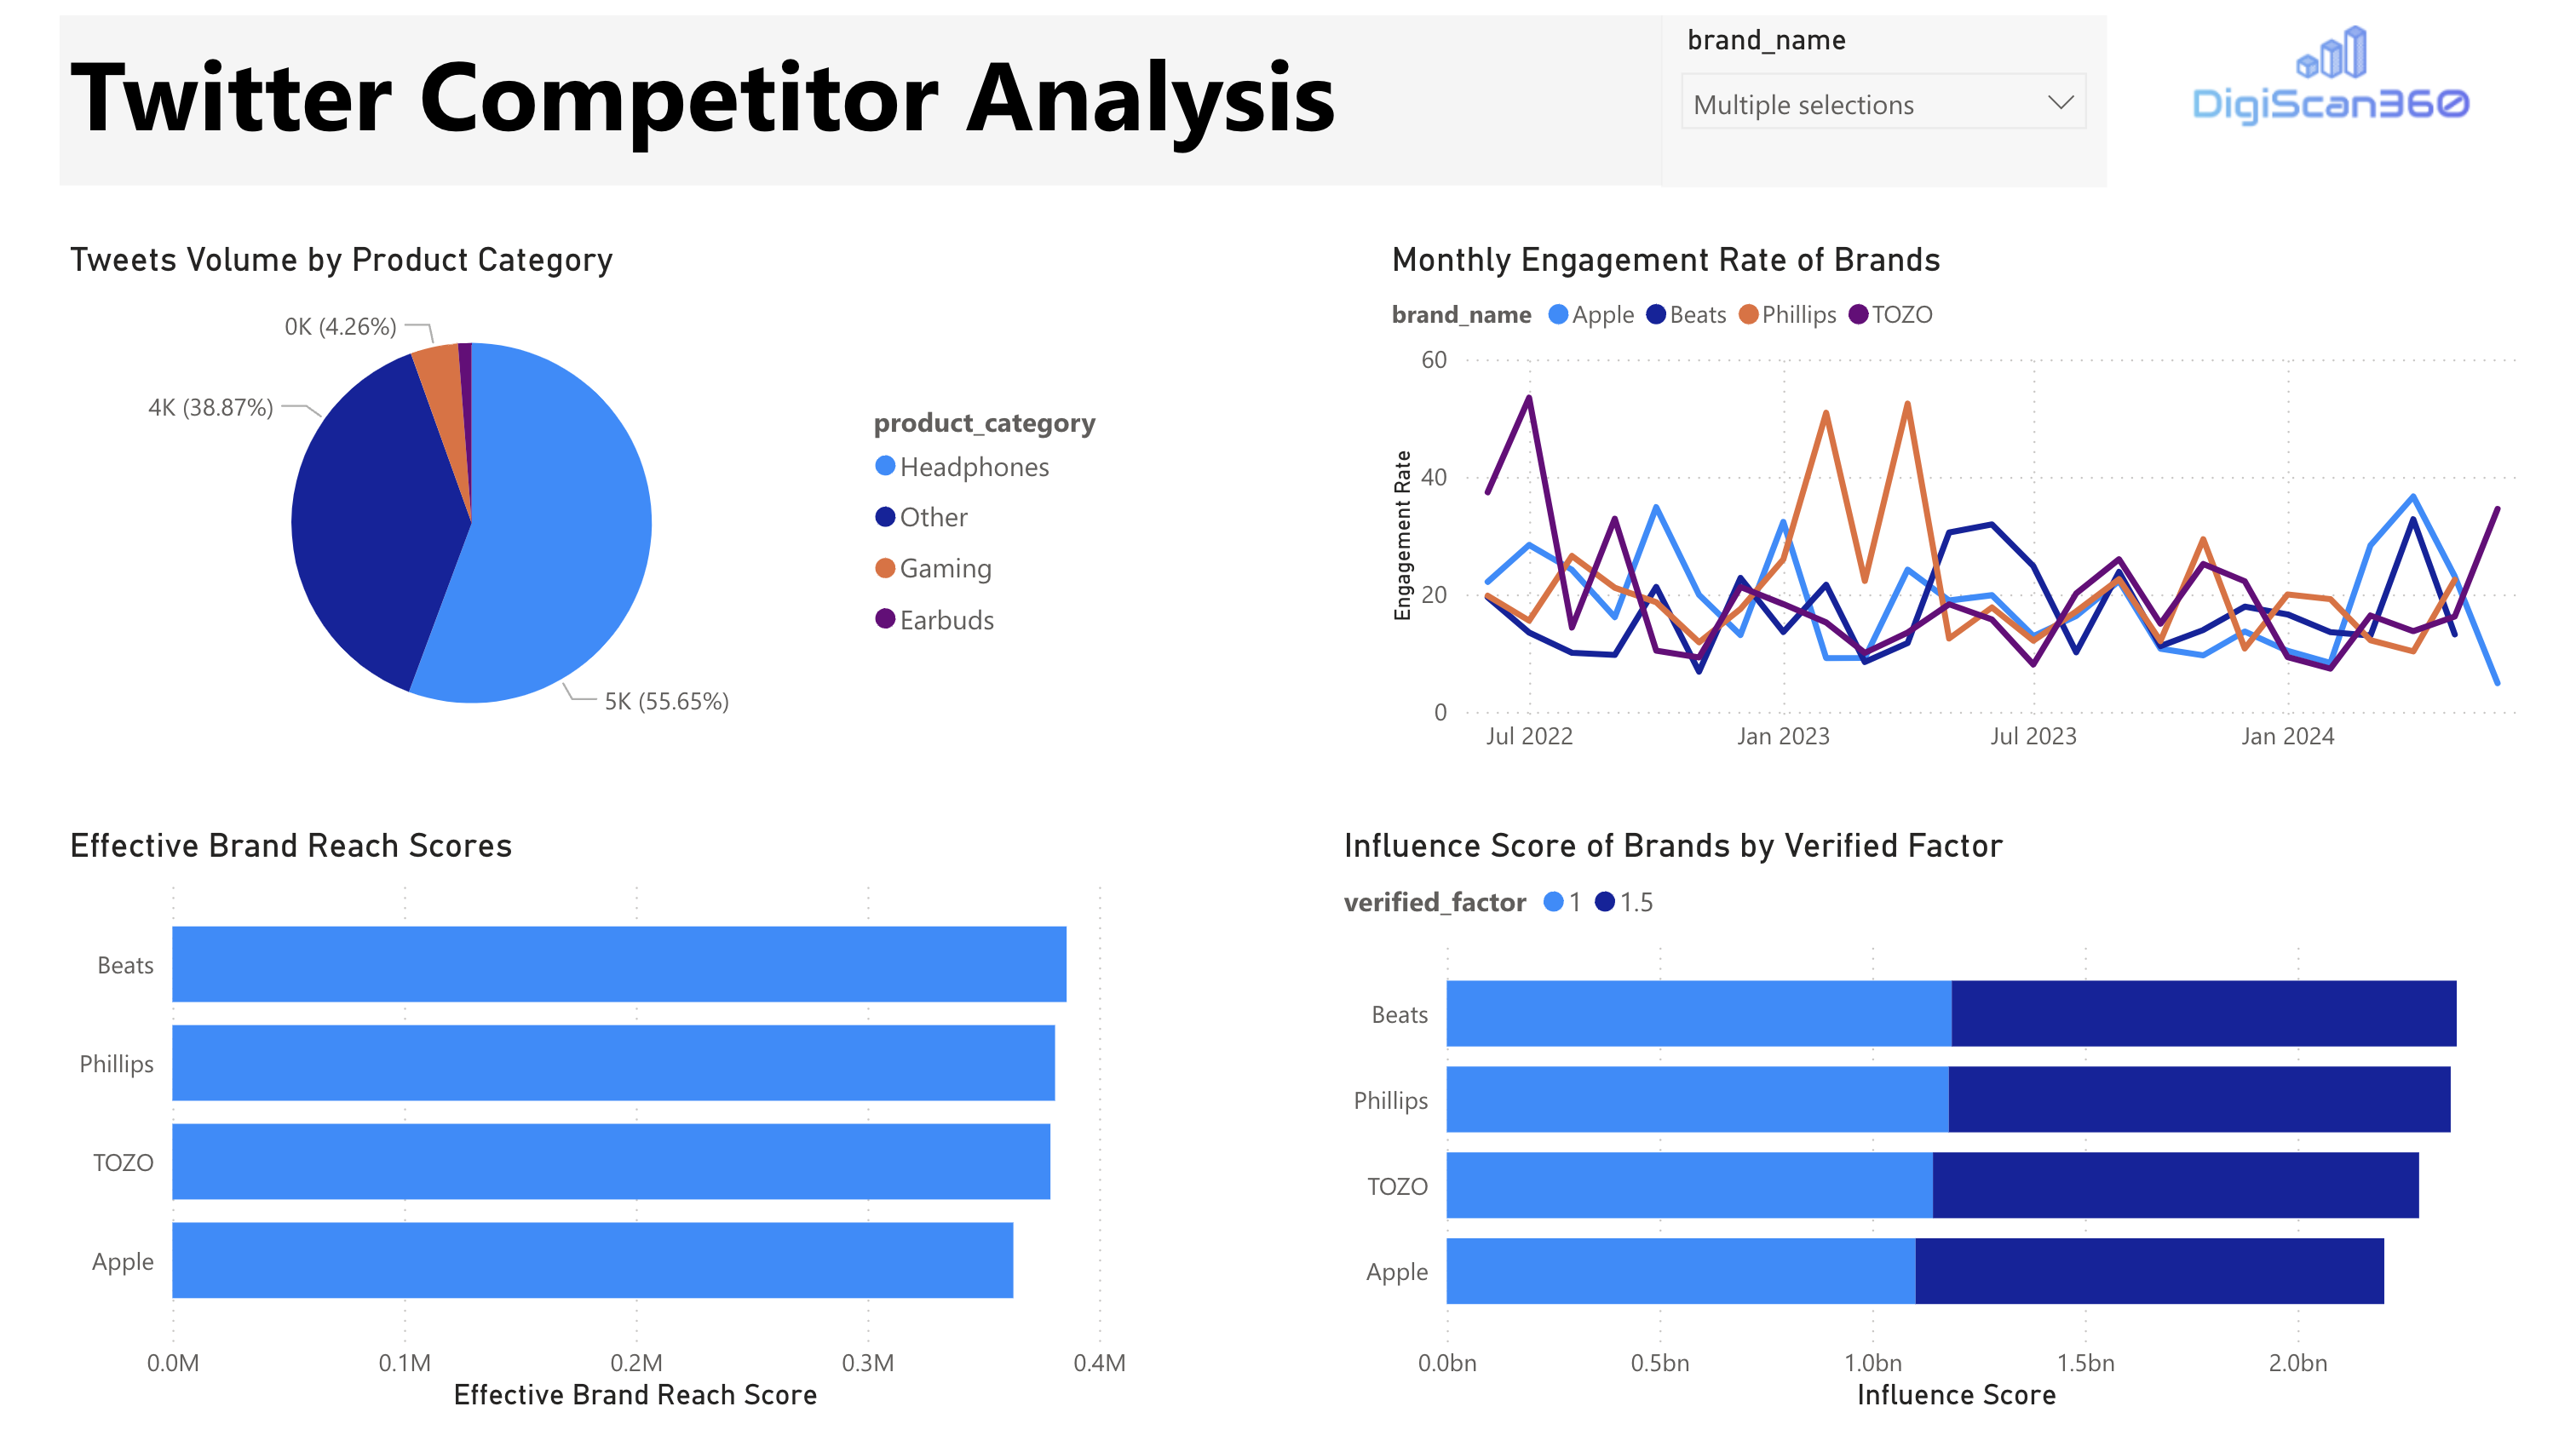
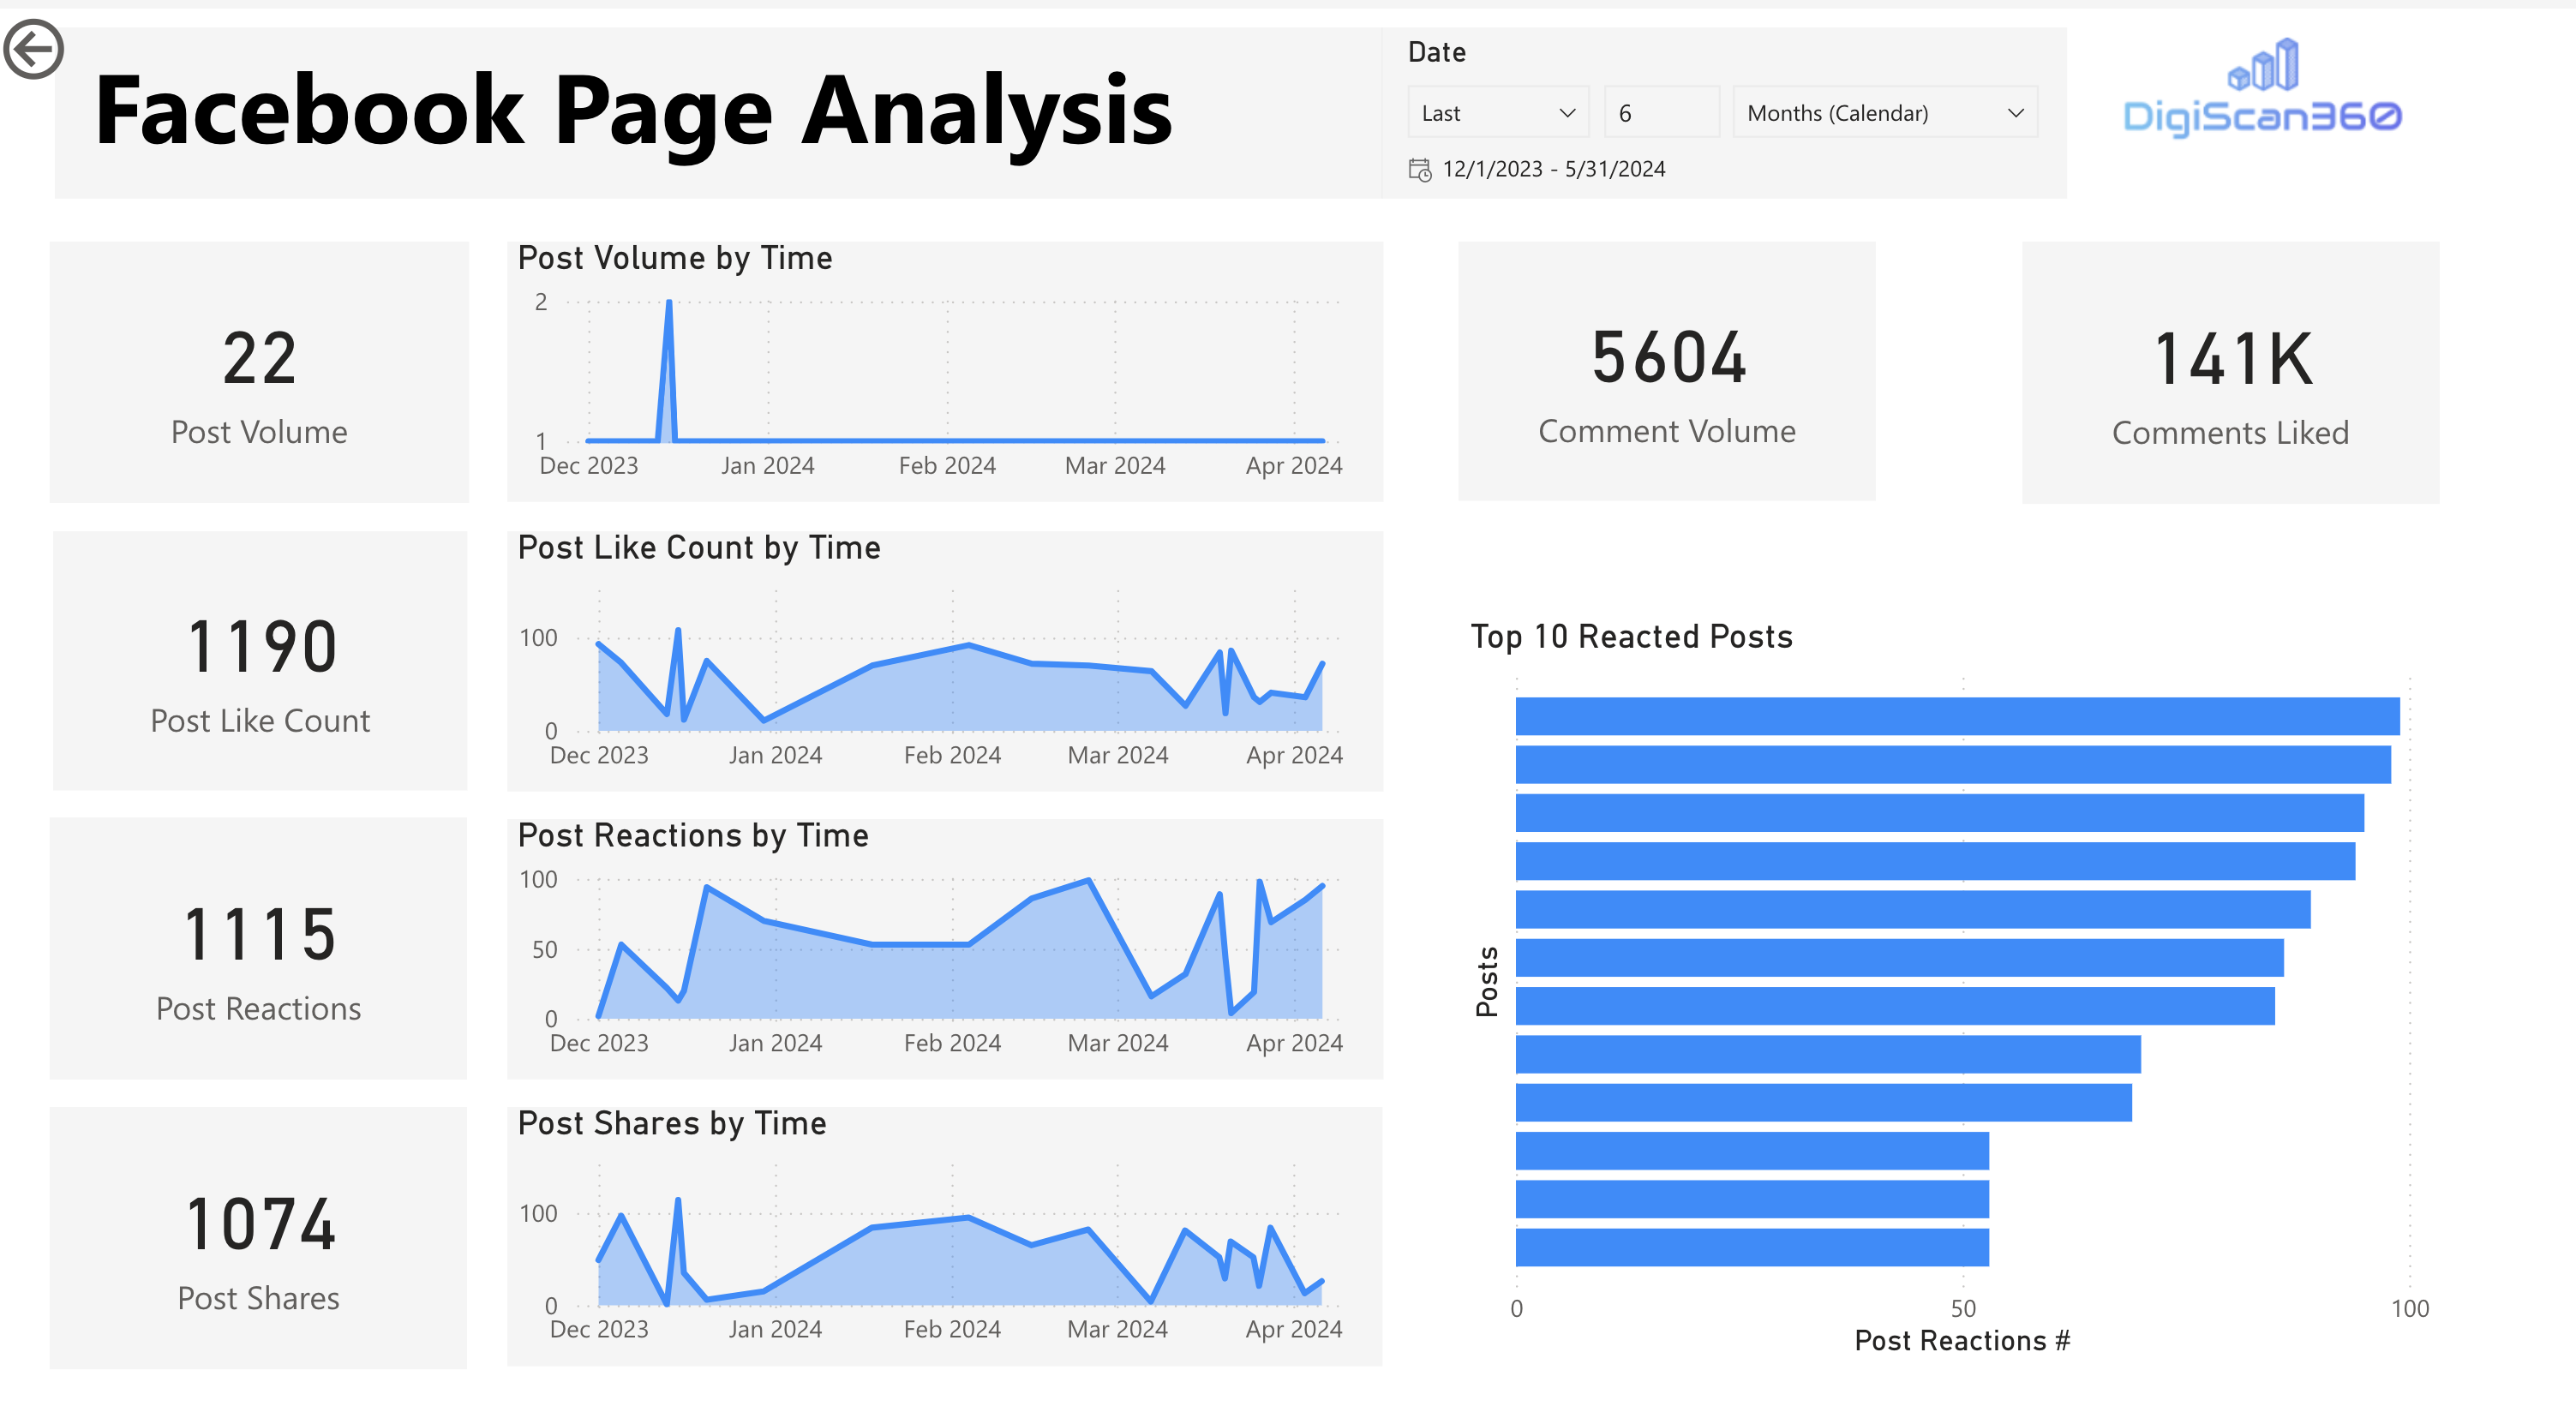
Key outcomes include:
- Descriptive analysis of engagement and reach
- Cross-platform brand comparison
- Aggregation of semantic and sentiment features
- Validation of end-to-end data pipelines
- Complementary graph-based exploration
Technologies
Python, PySpark, LLMs, Microsoft Fabric, Azure Data Factory, Power BI, GraphDB, SPARQL